

To view a company's details on Scrab, use the search bar to enter its ticker or company name. If a company is listed on multiple exchanges, it's best to select the version from its native exchange.
This ensures financial data and stock prices are presented in the same currency, avoiding potential confusion during analysis. The exchange will be represented by the country flag next to the ticker name.
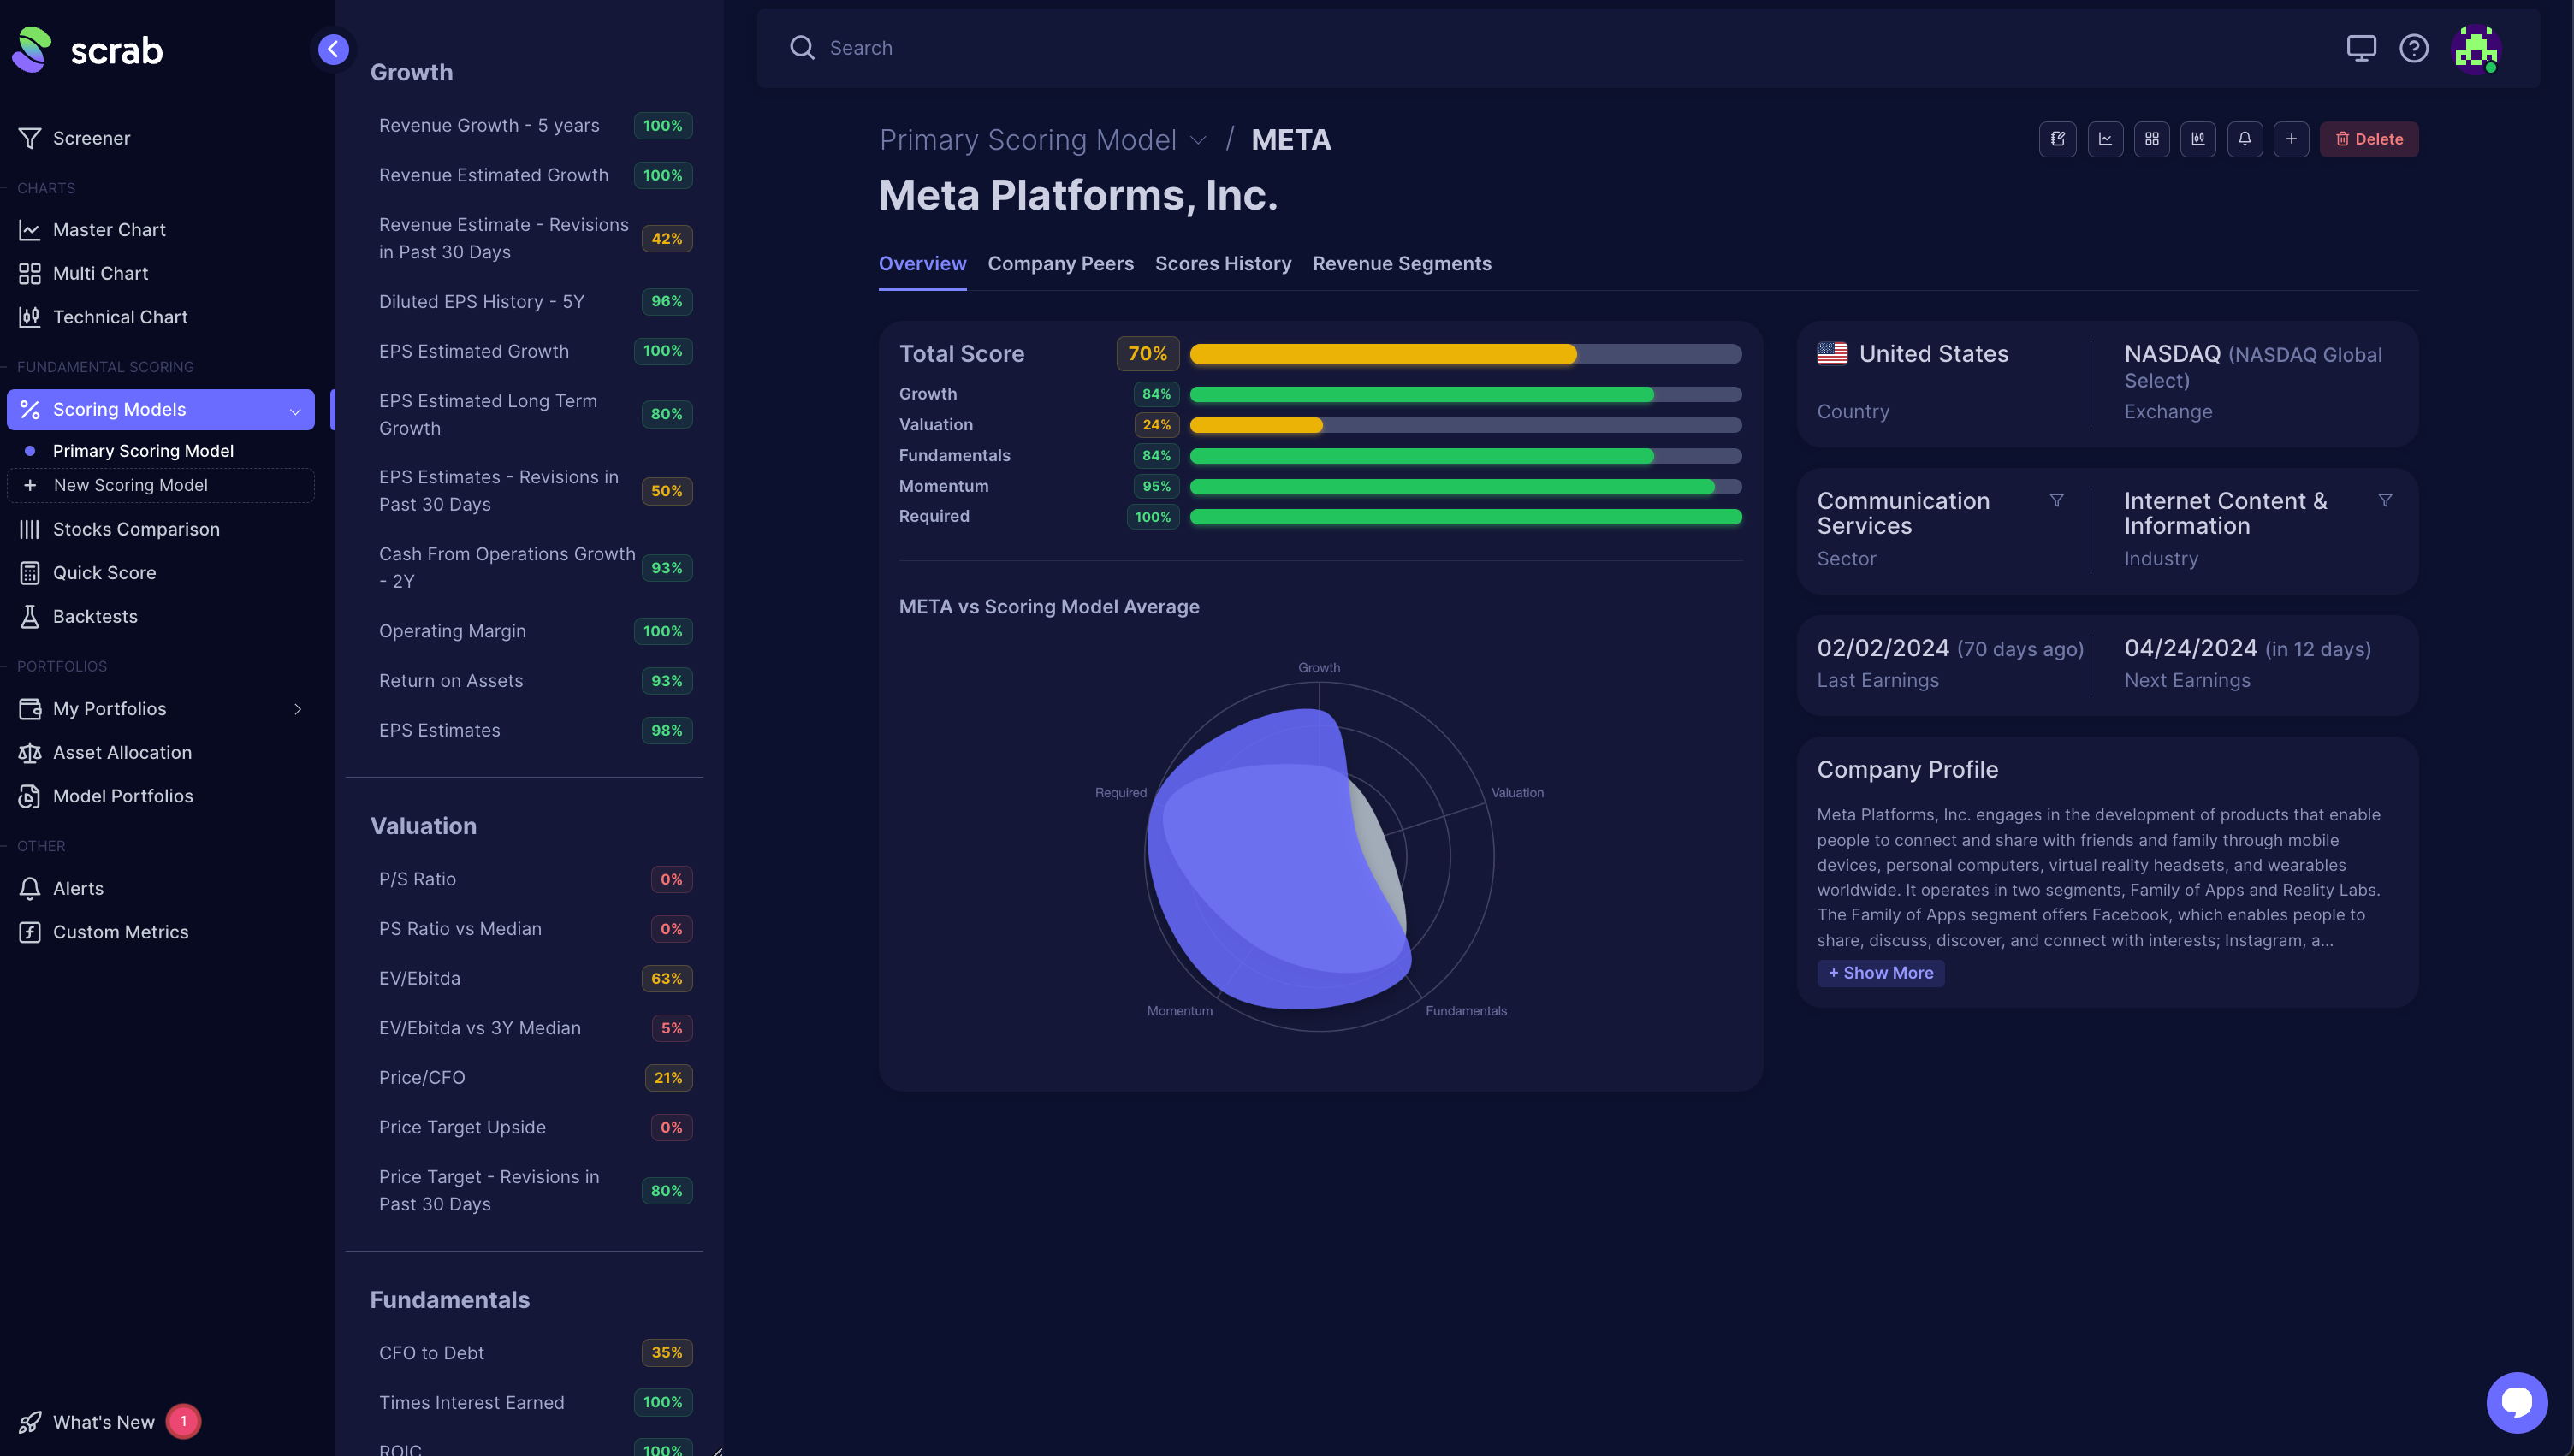
After selecting the company, you will see a profile similar to this one:
Let's go ahead and break down each section:
The company details are displayed in the view using the basic default scoring model. We’ve already set up some important predefined metric rules to make your life easier.
The Overview tab visually represents the company's scores based on the metric rules currently in the scoring model. This view is a quick way to see how well this stock performs in areas important to you. We've also included the companies' country, exchange, sector & industry, as well as their last earnings date and the next earnings date.
We've included the additional tabs for more information:
- Company Peers: compare companies from the same industry locally and globally, providing a quick overview of their scores.
- Scores History: view each metric's historical scoring based on the current strategy.
- Revenue Segments: displays the business and regional segments in which this company falls.
- Company vs. Model Average Chart: the blue area represents your company's scores, while the grey area shows the average scores of its key rivals, enabling a swift comparison with the industry standard.
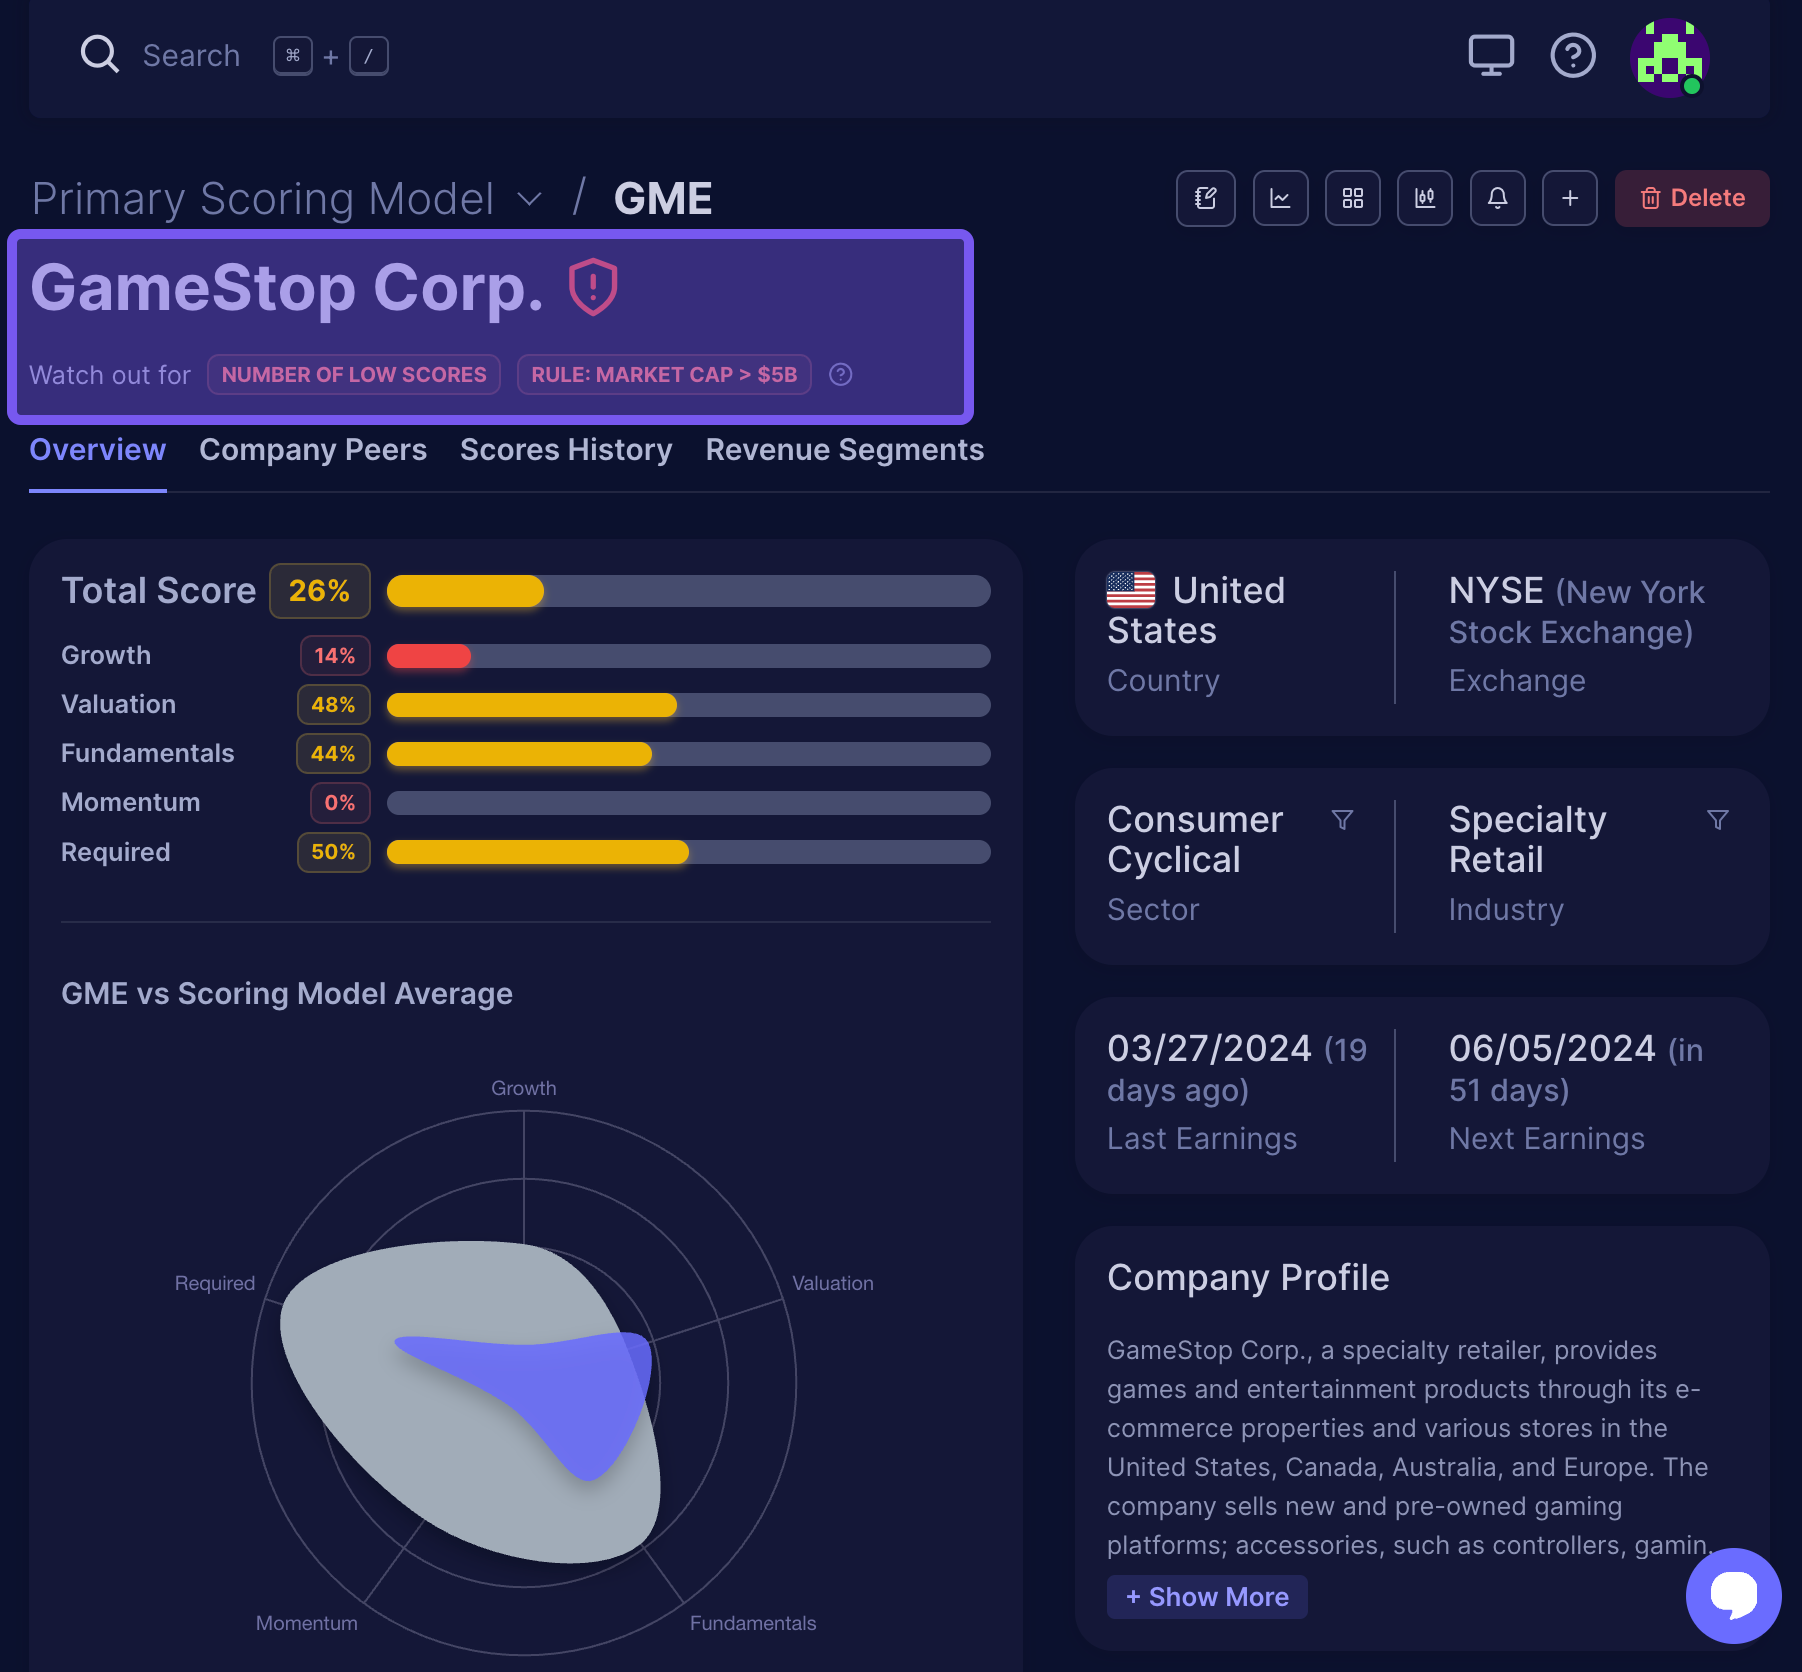
Alerts/Warnings
Scrab will always warn you if a company doesn't meet certain criteria based on the current scoring model settings and rules marked as must-haves. This could either be that one of the must-have rules returned with zero points or that too many rules have low scores.
These alerts help you decide whether you want to take the risk on low-scored stocks or not.
Analysis Settings
Towards the top right of the Company Details, we provide you with a few addtional tools and settings you can use as you do your company/stock research:

- Edit Notes & Sentiment Points: Note any of your thoughts or insights. From here, you can also get '+/-' points based on your preference and assign the company to a group.
- Master Chart: review metric(s) for a more visual snapshot.
- Multichart: use this option to view multiple metrics in one view for the company.
- Technical Chart: useful if you want to do some technical analysis.
- Manage Alerts: create alerts for a score percentage or metric value changes.
- Add to Scoring Model or Portfolio: If you want this company to be part of your strategy or portfolio, click the '+' button.
- Delete: if this company is already part of your scoring model, you can delete it from here.
Metric Categories and Rules
On the left side, close to the navigation page, you can view the Rule Categories and the metrics rule for the current Scoring Model. You can add, edit, delete, or create a new category or rule from here.
Please visit the page "Adding and Configuring Rules" for more details.