

The Tear Sheet in Scrab helps you analyze your portfolio or strategy's performance by comparing it with benchmarks.
First, run a backtest to get results. Then, from the results page of either Model Portfolios or Backtests*, click the 'Open Tear Sheet' button to open the Tear Sheet. This feature allows for a detailed performance review against selected benchmarks.
It's up to you which benchmark you'd like to choose, whether an index (written with a ^ mark) or any of the 37K+ financial instruments available. The most popular way is to compare your results against the S&P 500.
Once you click the tear sheet button, you should see a view like the one below:
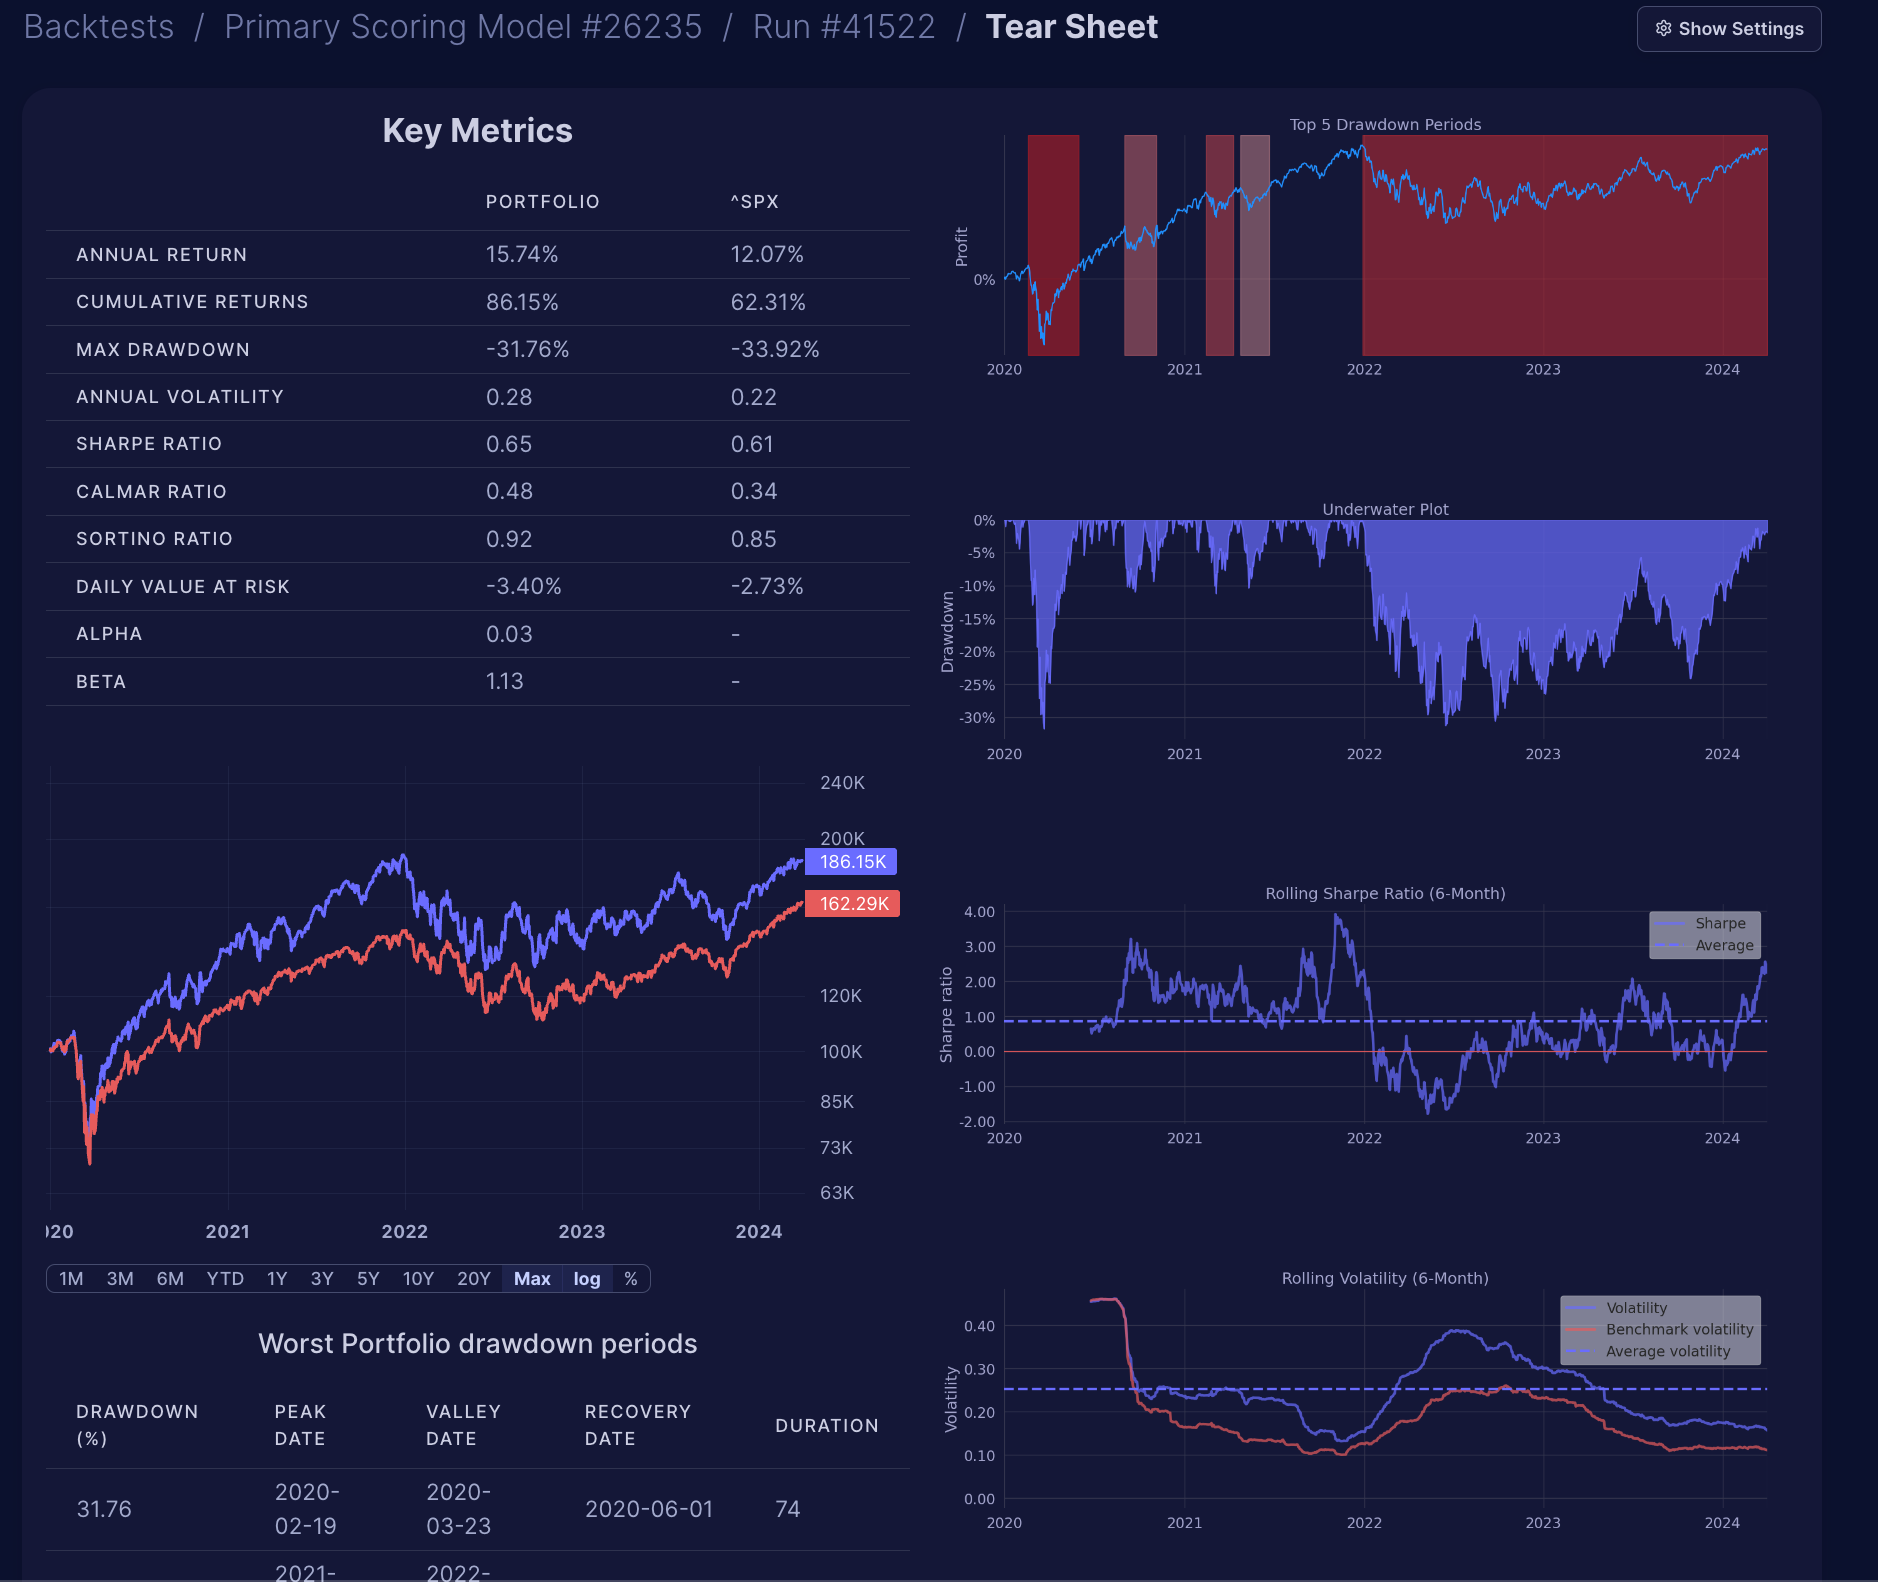
The Tear Sheet provides detailed performance insights into your strategy, including annual and cumulative returns, maximum drawdown, volatility, and key ratios like beta and alpha, alongside a direct comparison with a benchmark (e.g., S&P 500). This enables a clear evaluation of whether your strategy outperforms or underperforms the market.